Statewide survey shows childhood obesity rates in East Texas
Published 8:49 pm Tuesday, September 19, 2017
- Courtesy
More than 20 percent of certain school-aged children in East Texas are considered obese or severely obese, but the region is not among the worst in the state, according to a new report.
The information, presented Tuesday in a webinar, comes from the 2015-16 School Physical Activity and Nutrition (SPAN) Survey, which involved 280 schools in some 70 school districts statewide.
It was conducted through a partnership between the Texas Department of State Health Services, The University of Texas Health Science Center at Houston and the Michael & Susan Dell Center for Health Living.
The data shows that although East Texas is not among the worst regions in the state when it comes to child obesity, that isn’t saying much because the “best” results in the state in some cases show at least a 15 percent obesity rate.
The goal of the SPAN Project is to monitor the trends in body mass index (BMI) of school-age children in the fourth, eighth, and 11th grades, according to a website about it.
BMI is a measure of body fat based on height and weight. For the purposes of the survey, obesity was defined as a BMI at or above the 95th percentile.
More than 17,000 student surveys were collected from Texas students in second, fourth, eighth and 11th grades, with these surveys representing the total 1.3 million students statewide in those grade levels.
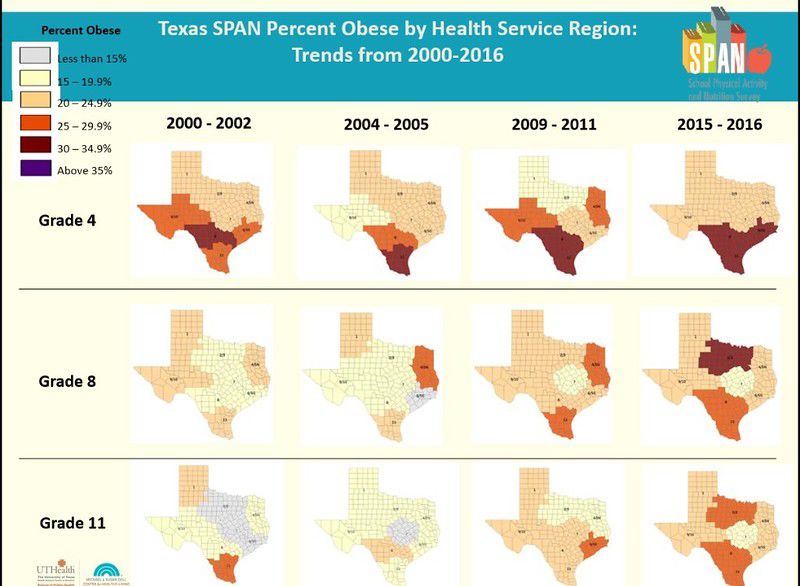
This is the fourth SPAN survey conducted in Texas with the others covering 2000-02, 2004-05 and 2009-11.
Because one in 10 U.S. children live in Texas, what happens in this state has weight nationwide, public health leaders said.
The study involved measuring the height and weight for the participating students, having the students or, in the case of second-graders, their parents, fill out a self-report questionnaire and complete a take-home survey.
The data was broken down by health service regions. Regions 4 and 5 encompass about 35 Northeast Texas counties, including Smith and every county it touches.
Looking at the East Texas region over time, the percentage of obese children actually declined in fourth and eighth grades between the 2009-11 survey and the 2015-16 survey.
However, it increased for the 11th-graders in the region during that same timeframe.
South Texas and the Rio Grande Valley had the highest percentage of obese children in fourth grade and tied the North Texas region for the highest in 11th grade. The North Texas region was highest for the percentage of obese eighth-graders.
As part of the survey, the participants answered questions about their weekly physical activity, sedentary behavior and dietary behavior.
One of the troubling trends statewide was that about half of fourth-graders and one-fourth of second-graders participate in 60 minutes of physical activity one day or less per week.
“It was very concerning for us to see that among the elementary school kids,” Dr. Deanna M. Hoelscher, director of the Michael & Susan Dell Center for Healthy Living, said.
Participation in organized sports peaked in the fourth and eighth grades statewide.
If students were not playing sports, they were spending a lot of time watching television or using electronic devices.
Almost 50 percent of surveyed second-graders had a television in their room (parents answered for this age group); 60 percent of fourth-graders and 70 percent of eighth- and 11th-graders.
Almost 70 percent of fourth-graders had a computer, iPad, tablet, phone or gaming console in the room where they sleep and close to 80 percent of eighth- and 11th-graders.
Second-graders were the only group of students to spend more time watching television than on electronic devices. In fourth grade it flipped and eighth- and 11th-graders spent four to five hours per day on a computer or similar electronic device outside of school time. In addition, they spent about two hours watching television.
Hoelscher said watching television in the room is associated with decreased sleep and grades and obesity.
Hoelscher said Texas was a leader when it came to obesity prevention policies, but those gains have been slightly eroded by the watering down of some state legislation.
She said those involved in the study would meet with the Partnership for a Healthy Texas coalition and provide this data to them so they can use the data when they develop a platform for legislative purposes.
In addition, local school districts that participated will receive individualized reports and they can work with local leaders to create school wellness policies and possibly initiate programs. The next SPAN survey is set for the 2019-20 school year.
“These data really should mobilize us to kind of move this forward,” Hoelscher said.
TWITTER: @TMTEmily
East Texas Children
Grade Level 2nd 4th 8th 11th
% Normal weight 66.6 61.1 61.6 60.3
% Overweight 12.1 17.5 18.2 16.7
% Obese 21.3 21.5 20.2 23.0
Texas Children
Grade Level 2nd 4th 8th 11th
% Normal weight 63.5 55.9 59.3 60.3
% Overweight 14.2 17.4 16.5 19.5
% Obese 22.3 26.7 24.2 20.2